Updated edition of the 2001 publication County Comparisons. The
county fallout values include data from the Hardtack and Underground Test Series.
County Comparisons was written in response to
a letter from a reader who said she only wanted to know one thing: when did
the fallout land in her backyard? And how did her county rate in comparison
with all the others in the United States?
It was a simple question, but not an easy
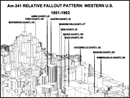
one to answer. iIt was first necessary to rank the counties in
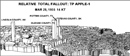
terms of total fallout (for 1951-1962). After determining when the
fallout descended on the counties, it was necessary to rank the
counties by dates. And there were over 400 dates in which fallout
occurred. After months of number-crunching, the results finally
appeared. Now, readers would be able to learn not ony when the
nuclear fallout came down (and how much) but how their county
ranked overall for that particular day.
Importantly, the values were for total fallout
(calculated from an examination of the Hicks Tables---discussed
in Volume 5--Calculations) and not for only one of the radioisotopes--I-131.
Volume 3 was published in July, 2001. Surprisingly,
the sales for this volume--listing only county rankings and fallout
values by date surpassed the first volume by a wide margin.
A complete list of our
technical books on nuclear fallout is found here.